Revenue per chair hour calculator
Your practice's most important productivity number.
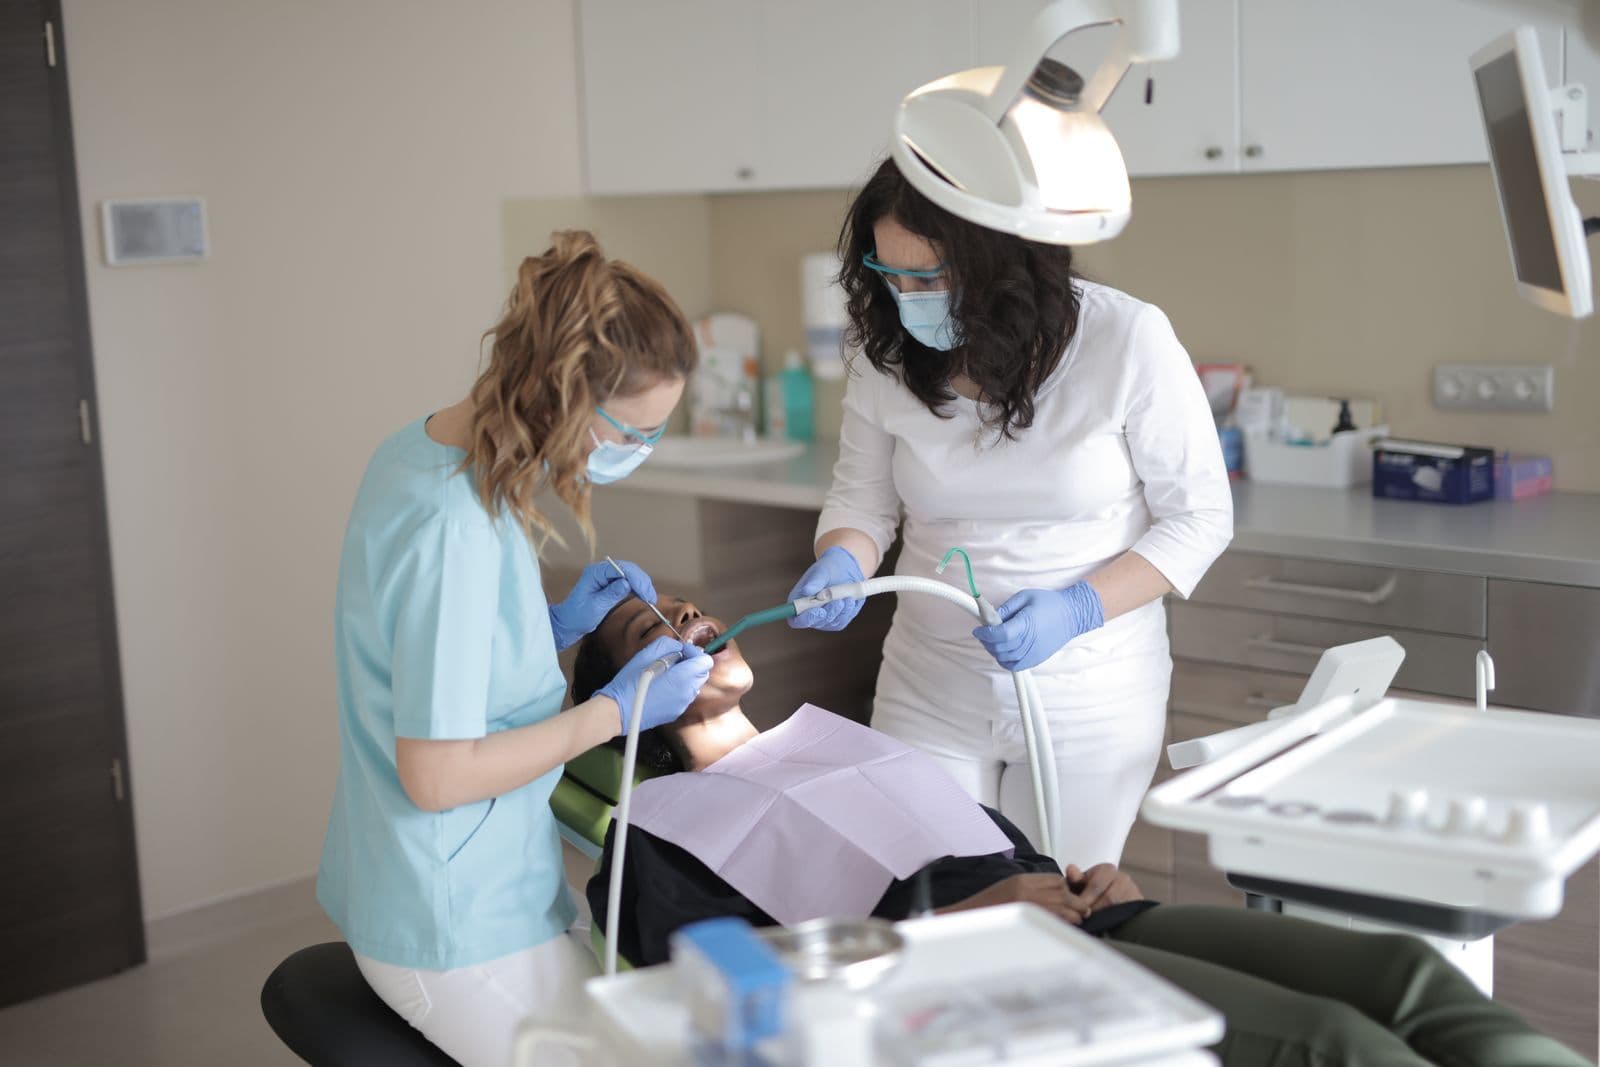
Revenue per chair hour is your annual revenue divided by the chair hours you had available, and it is the most useful single measure of how productively the practice uses its capacity. Multiply chairs by hours per day by days per year for available hours, then divide revenue by that figure. In most markets general dentistry runs at $350–$600 per available chair hour, with specialist and implant-heavy practices higher. Track the trend over time rather than chasing a fixed target, because fee levels and procedure mix vary widely.
How this is calculated
- Chair hours = chairs × hours per day × days.
- Revenue per hour = revenue ÷ chair hours.
Frequently asked questions
What is a good revenue per chair hour?
General dentistry commonly runs at $350–$600 per available chair hour in most markets. Specialist and implant-heavy practices run higher, and practices with a large hygiene component run lower per hour but with a lower cost base. The trend is more informative than the absolute figure.
Should I use available hours or booked hours?
Available hours give a capacity measure that includes the cost of idle time; booked hours give a clinical measure that shows what happens when a patient is in the chair. This calculator uses available hours. Run both and the gap between them is your utilisation problem.
How can I increase revenue per chair hour?
Fill idle time first, since that is revenue with almost no extra cost. Then look at scheduling, for instance blocking longer productive procedures rather than scattering short ones, and at whether fees have kept pace with costs. Procedure mix is the biggest long-term lever.
What data do I need from my practice software?
Annual collections, plus the number of chairs and the hours each was actually open, from your roster. Use collections rather than gross production so the figure reflects money that arrived.
How often should I calculate this?
Quarterly is enough, since the input figures change slowly. Compare each quarter with the same quarter a year earlier to remove seasonal effects.
Related calculators
All dentist calculatorsBenchmarks are indicative for general practice in most markets. Last updated 18 Sept 2026. See our methodology.